
The world's most popular free diagram tool — now with real simulation power.
Open any Draw.io (diagrams.net) process diagram, add real-world inputs directly on your shapes, and run what-if scenarios — all inside the diagram you already built.
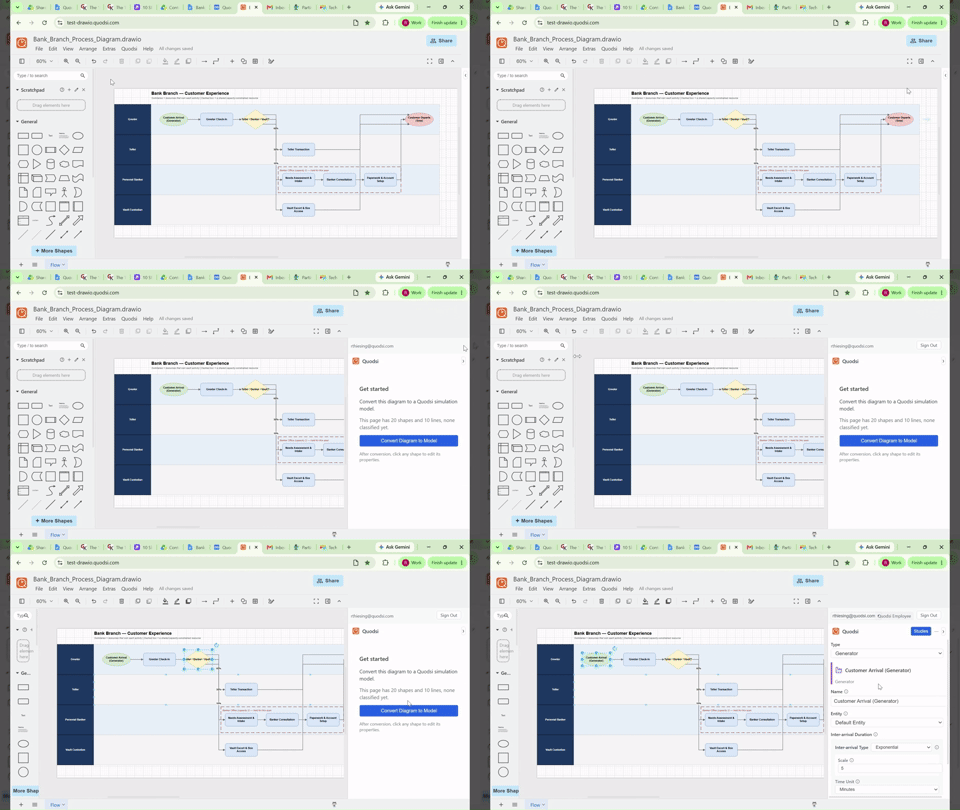
From static diagram to defensible evidence, step by step.
Open your existing Draw.io / diagrams.net process diagram. Quodsi reads your shapes automatically — no rebuilding required.
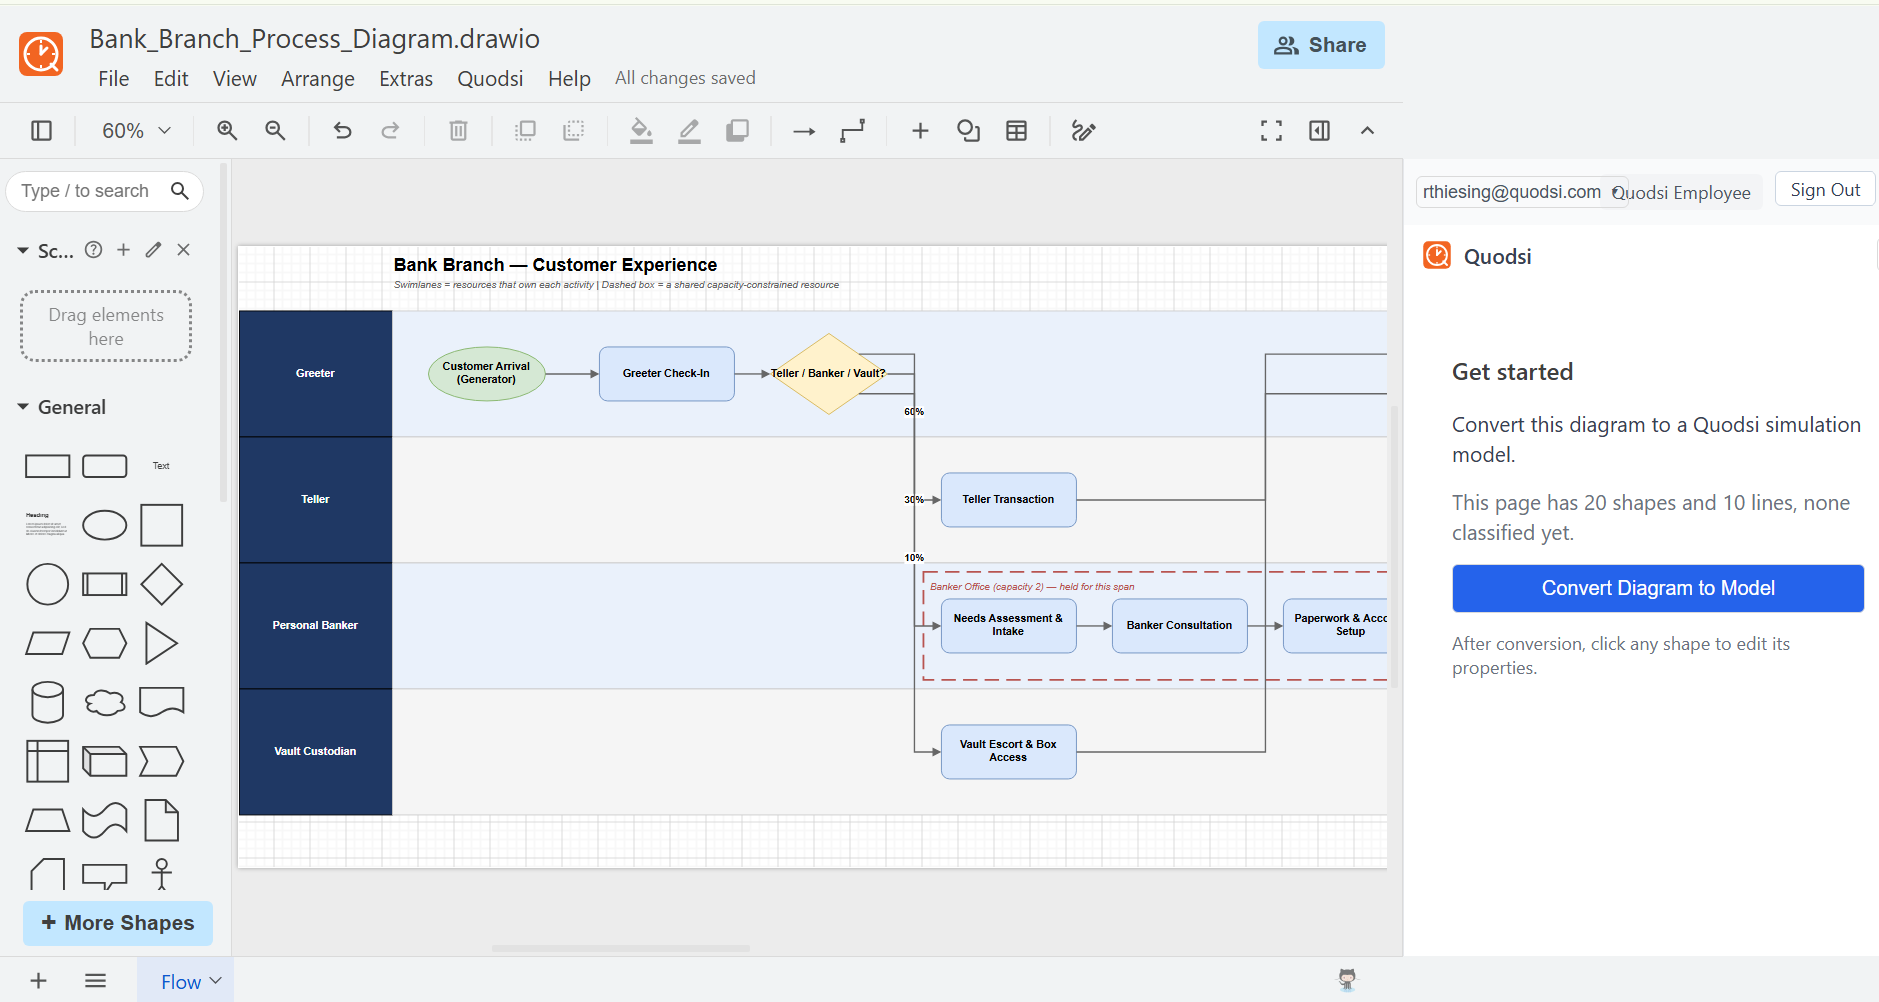
Add arrival rates, processing times, resource capacity, and variability directly on your shapes. Takes minutes.
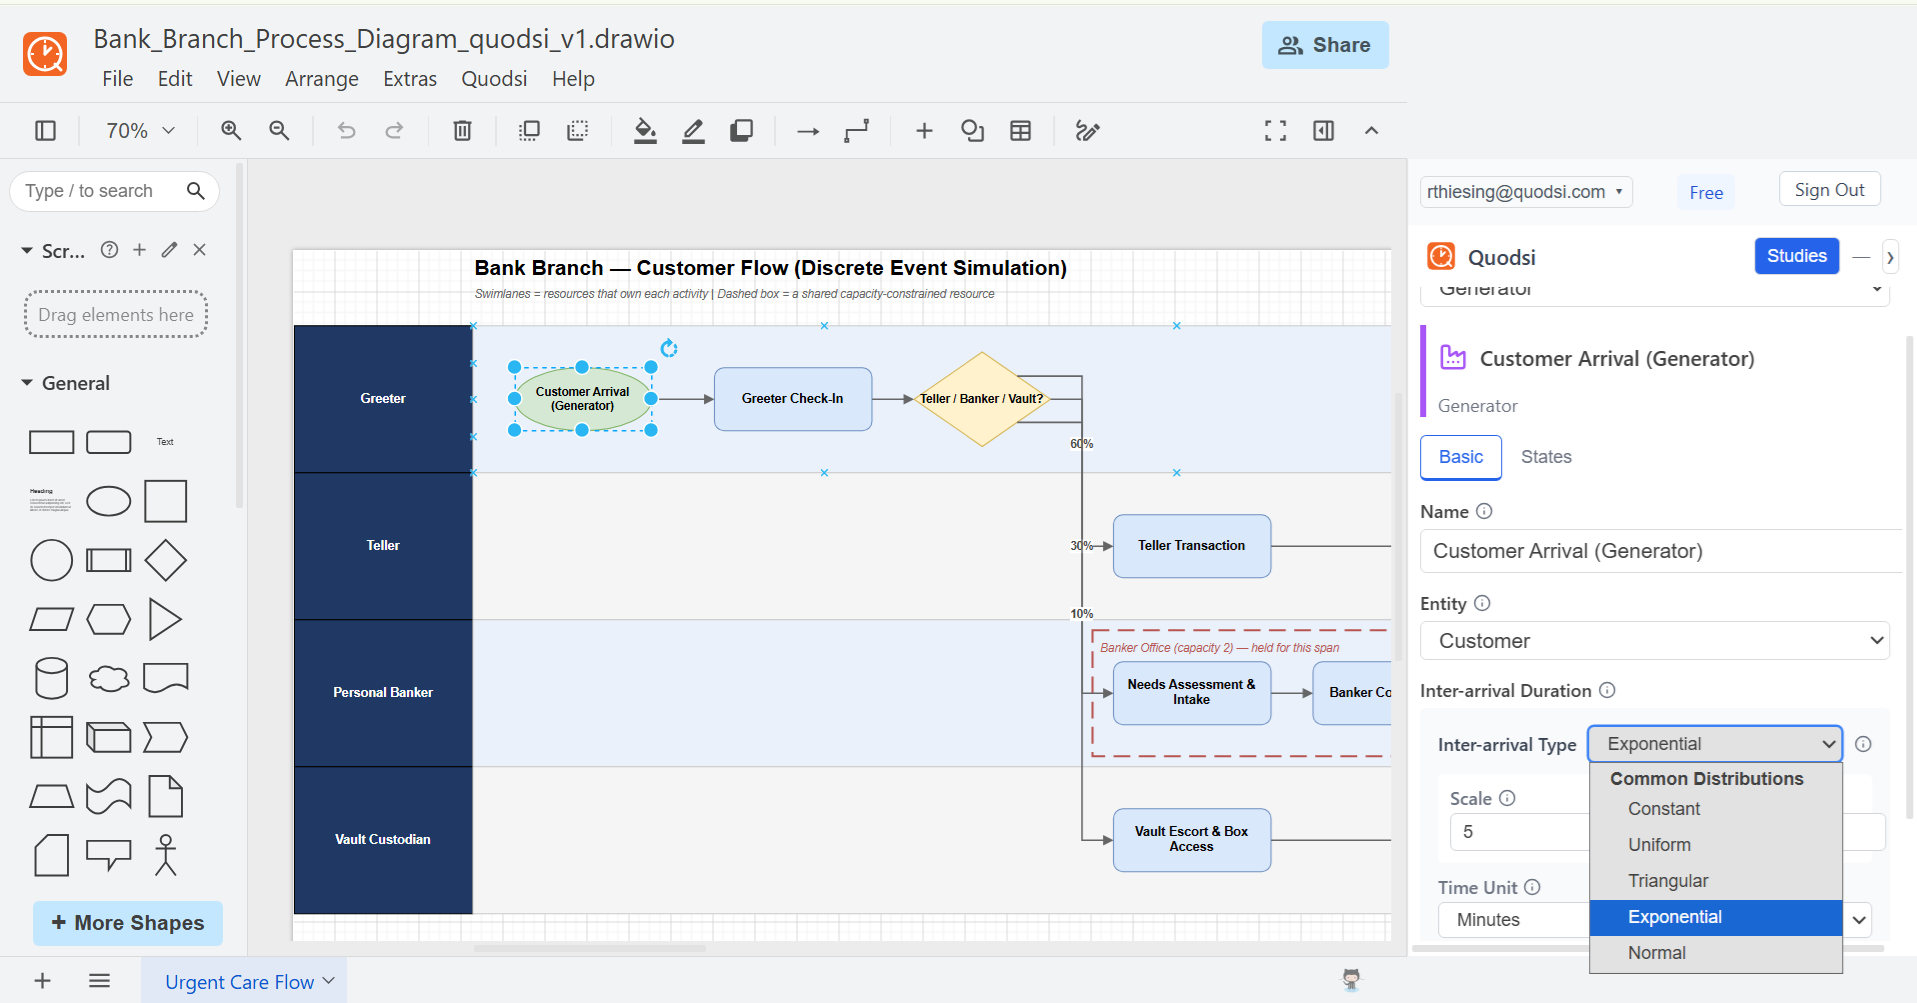
Add staff, remove steps, increase demand — test changes side by side without leaving the canvas.
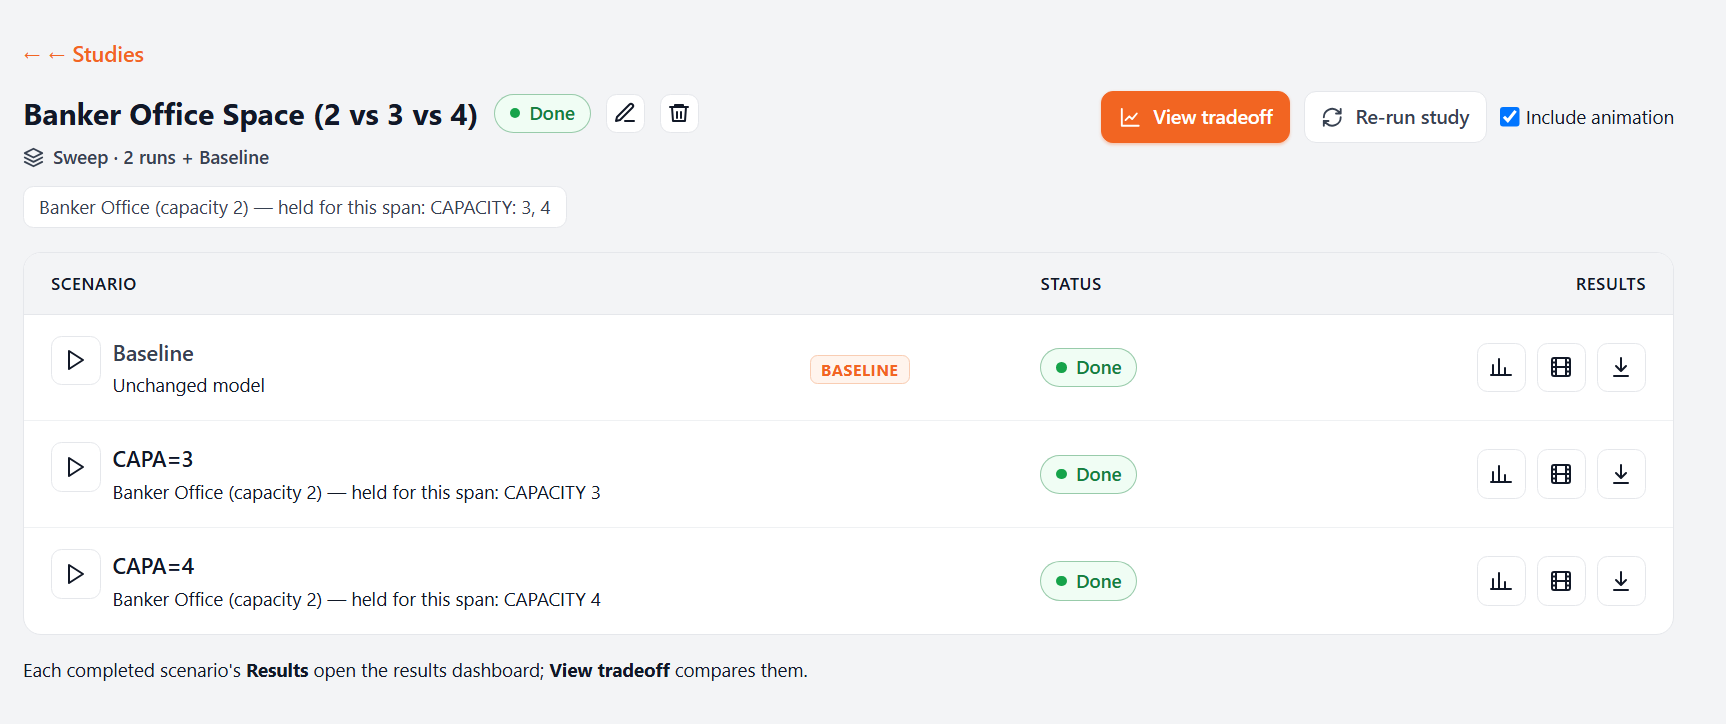
Throughput, wait times, utilization, and cost/service impacts — quantified and compared side by side.
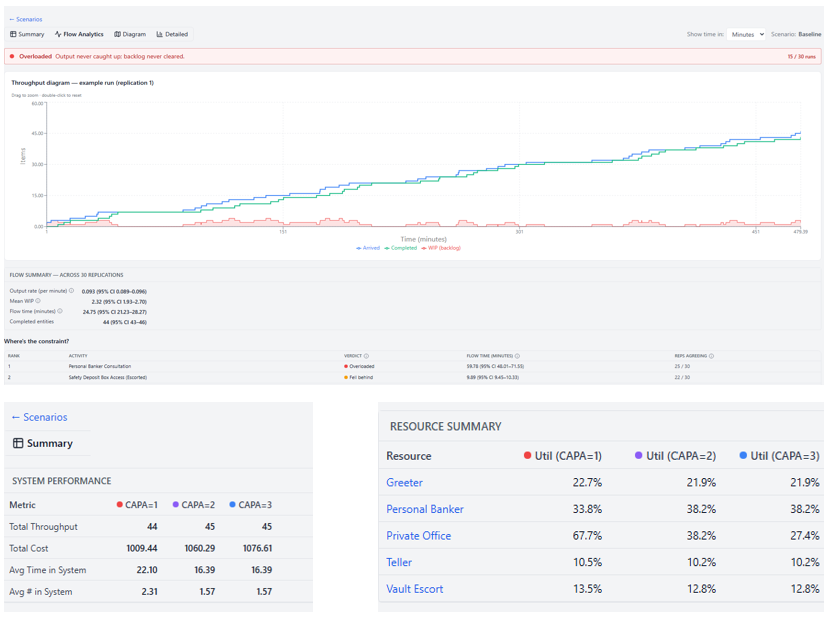
Take the results into your next presentation with evidence, not just a diagram.
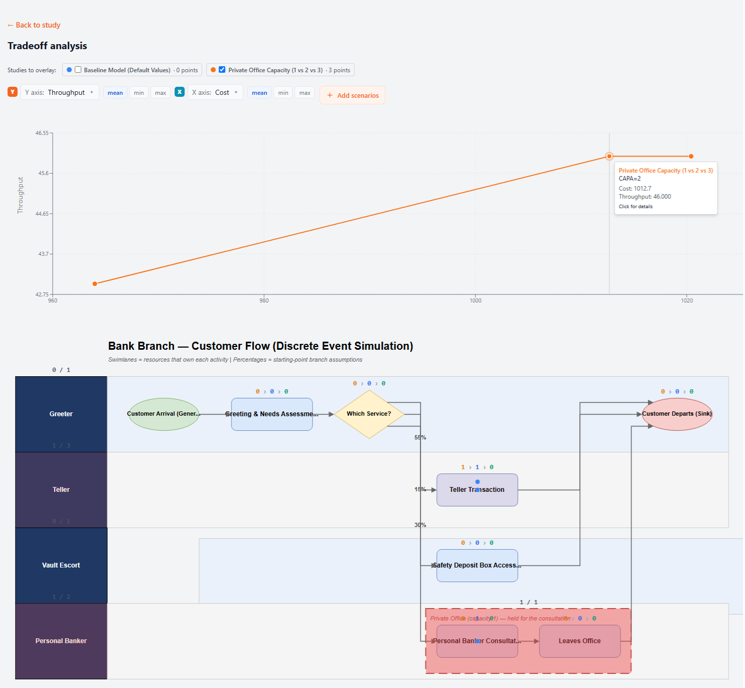
Watch a Draw.io diagram become defensible evidence.
From a process map to real performance metrics — in minutes, without leaving Draw.io.
No separate modeling environment, no rebuilding your diagram in specialist software, no coding. Lucidchart and Draw.io are both live today, with more platforms — including Visio and Miro — on the roadmap.
Ready to see it inside Draw.io?
Book a discovery call to see it in action.